Hydrographs
About Hydrographs
 The Water Replenishment District (WRD) closely monitors groundwater elevations within the Central and West Coast Basins in southern California using its network of aquifer-specific monitoring wells. The WRD Hydrographs website provides the data from these efforts to the public, helping us understand how much water there is and has been in our underground aquifers. Water levels for all monitoring wells are measured by WRD field staff a minimum of four times per year, while some wells are equipped with automated data loggers which measure water levels daily.
Aquifer-specific monitoring wells are constructed in nests of individual wells that are installed to different depths within a single borehole. Each of the nested wells is placed so that its perforated interval intercepts groundwater from a distinct aquifer unit, and each is isolated from one another within the common borehole using a bentonite seal.
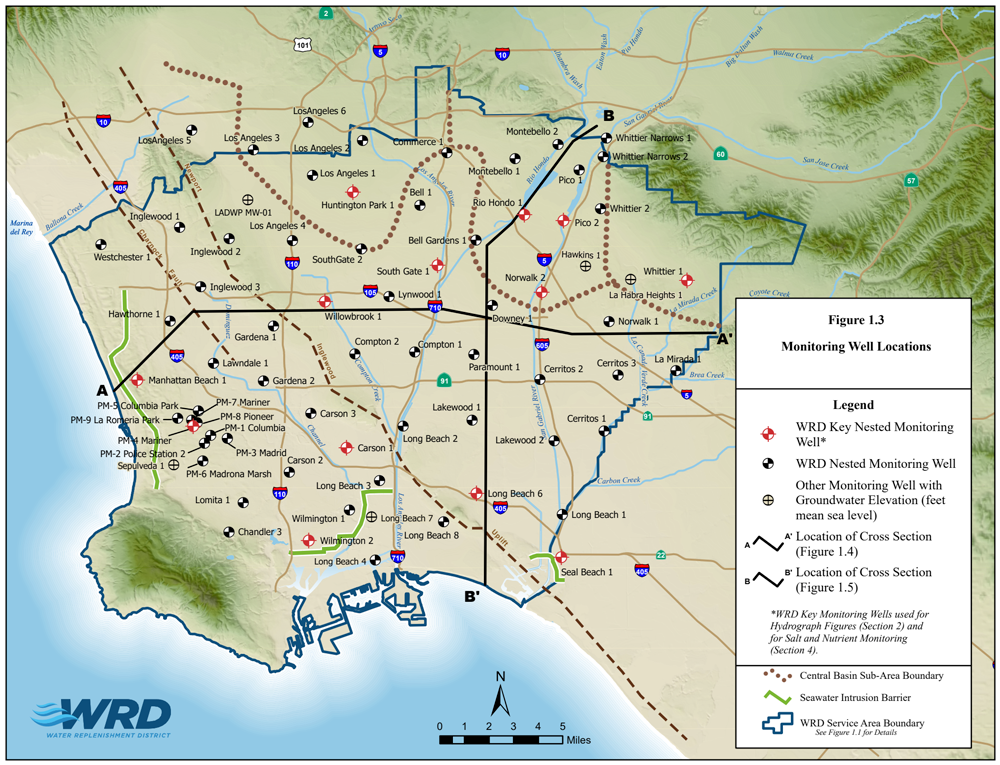
WRD’s current nested monitoring network currently consists of 373 individual wells located at 67 nested well sites. Soon after each nested well site is completed, WRD installs pressure transducers into each to depths of between 20 and 100 feet below static water level. The transducers are programmed to measure and record the height of the water column above them every six hours. WRD collects the transducer measurements periodically and imports them into its water level database where they are converted from pressure measurements to groundwater elevations.
Hydrographs are constructed from transducer data by plotting each calculated groundwater elevation measured in an individual monitoring well against the time it was collected; each point thus plotted is then connected with a continuous line. The resulting line extends from the initial measurement to the most recent within the individual well and provides a quick visual reference of how groundwater elevations have changed in that particular aquifer through time. Hydrographs constructed for an individual well can illustrate a variety of different phenomena including seasonal fluctuations caused by variations in natural and artificial recharge, the effects of regional processes such as pumping or other basin discharge on local groundwater elevation, or long-term climatic effects such as drought.
Hydrographs are also often useful in comparing groundwater elevations within the various individual monitoring wells at a given nested well site. To do so, the hydrographs constructed for each individual monitoring well are plotted on a single chart. This comparison is useful in assessing the amount of communication between adjacent aquifers, or in assessing which aquifer zones are most influenced by regional factors such as pumping or recharge. Likewise, hydrographs from individual monitoring wells at one nested well site can be compared to those from another to do things like correlate conditions within a single aquifer across some lateral distance.